

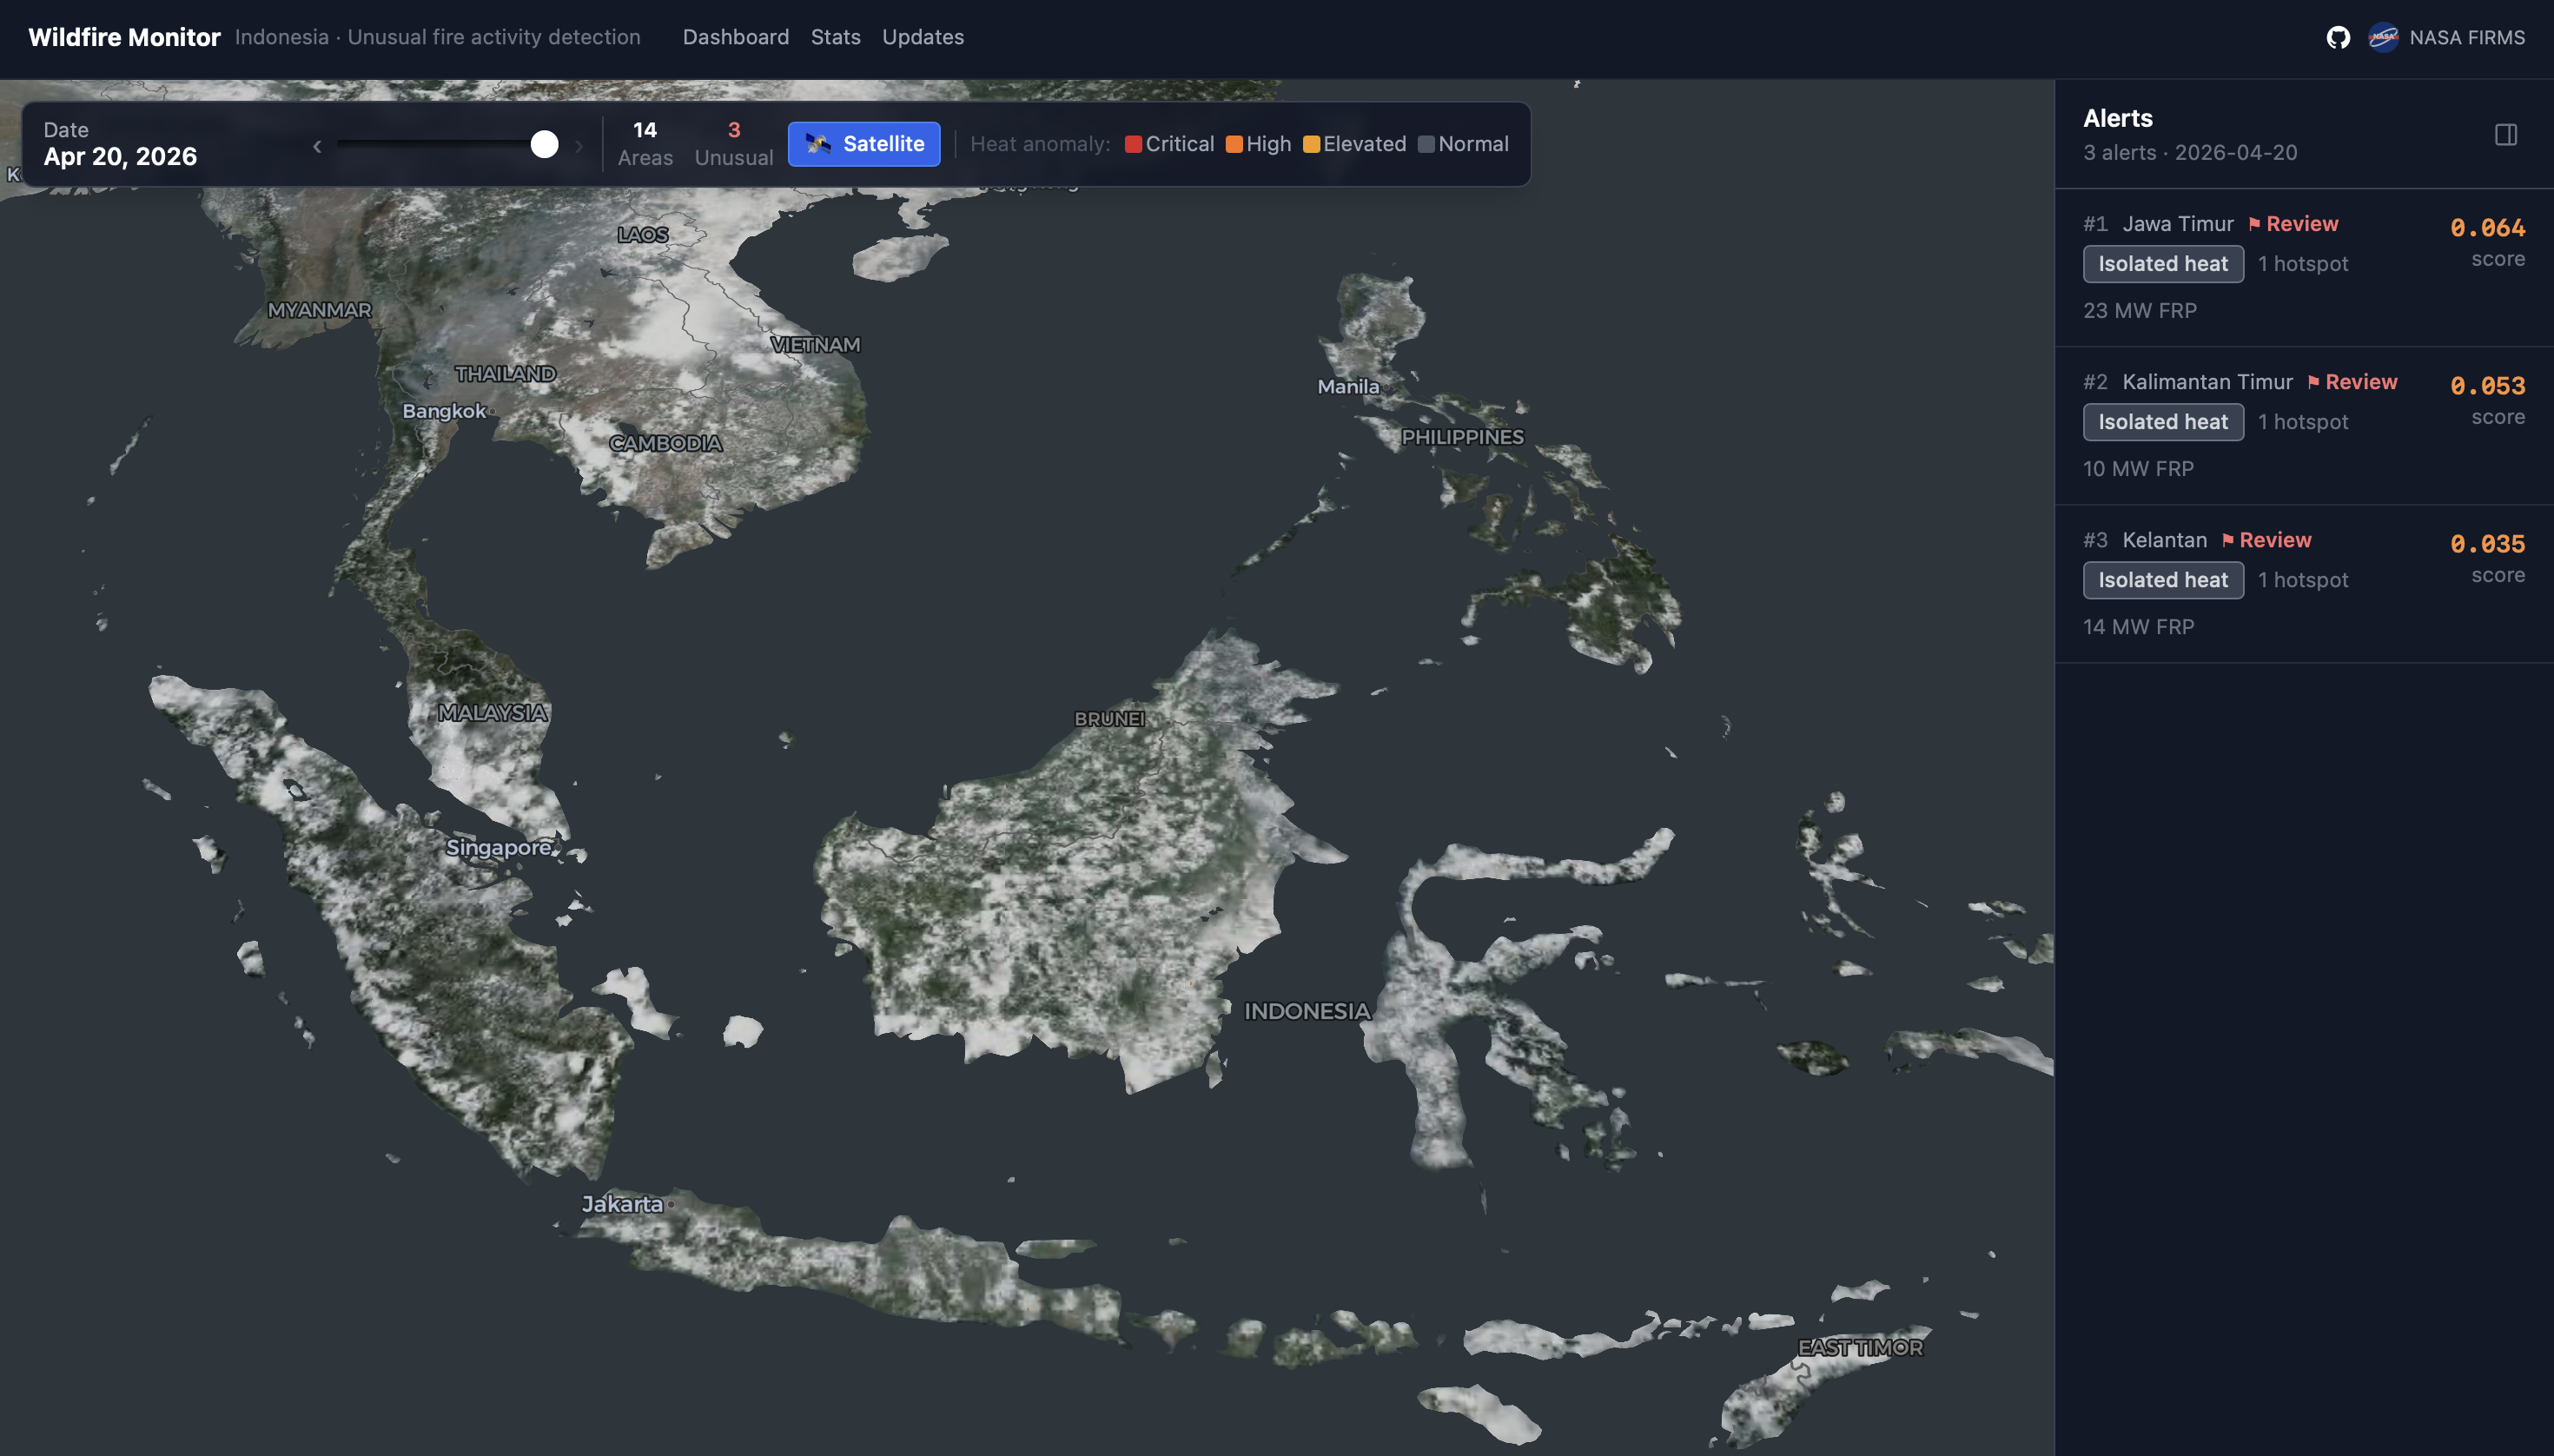
wildfire-detection is an open-source project built by Itsavirus to change that. It ingests NASA FIRMS satellite data, applies Isolation Forest anomaly detection across a hexagonal spatial grid, and delivers ranked daily alerts all in under an hour, fully automated, and free to self-host.
The project is deployed and live for Indonesia, with a public dashboard and MIT-licensed codebase. It is designed to be adaptable to any geography where NASA FIRMS data is available.

Raw hotspot records carry no context. A single detection could be agricultural burning, an industrial flare, or the start of a major wildfire. Without a way to distinguish anomalous behaviour from baseline activity and to rank what matters most on any given day the data overwhelms rather than informs.
The challenge was not detecting fire. Satellites already do that. The challenge was detecting fires that matter anomalies that deviate meaningfully from what is normal for a given location and time.
Existing approaches to this problem typically rely on fixed thresholds: flag anything above X hotspots, or above Y fire radiative power. Those thresholds work in some regions and fail in others. They cannot adapt to seasonal variation, geographic heterogeneity, or the difference between a controlled burn and a spreading wildfire.
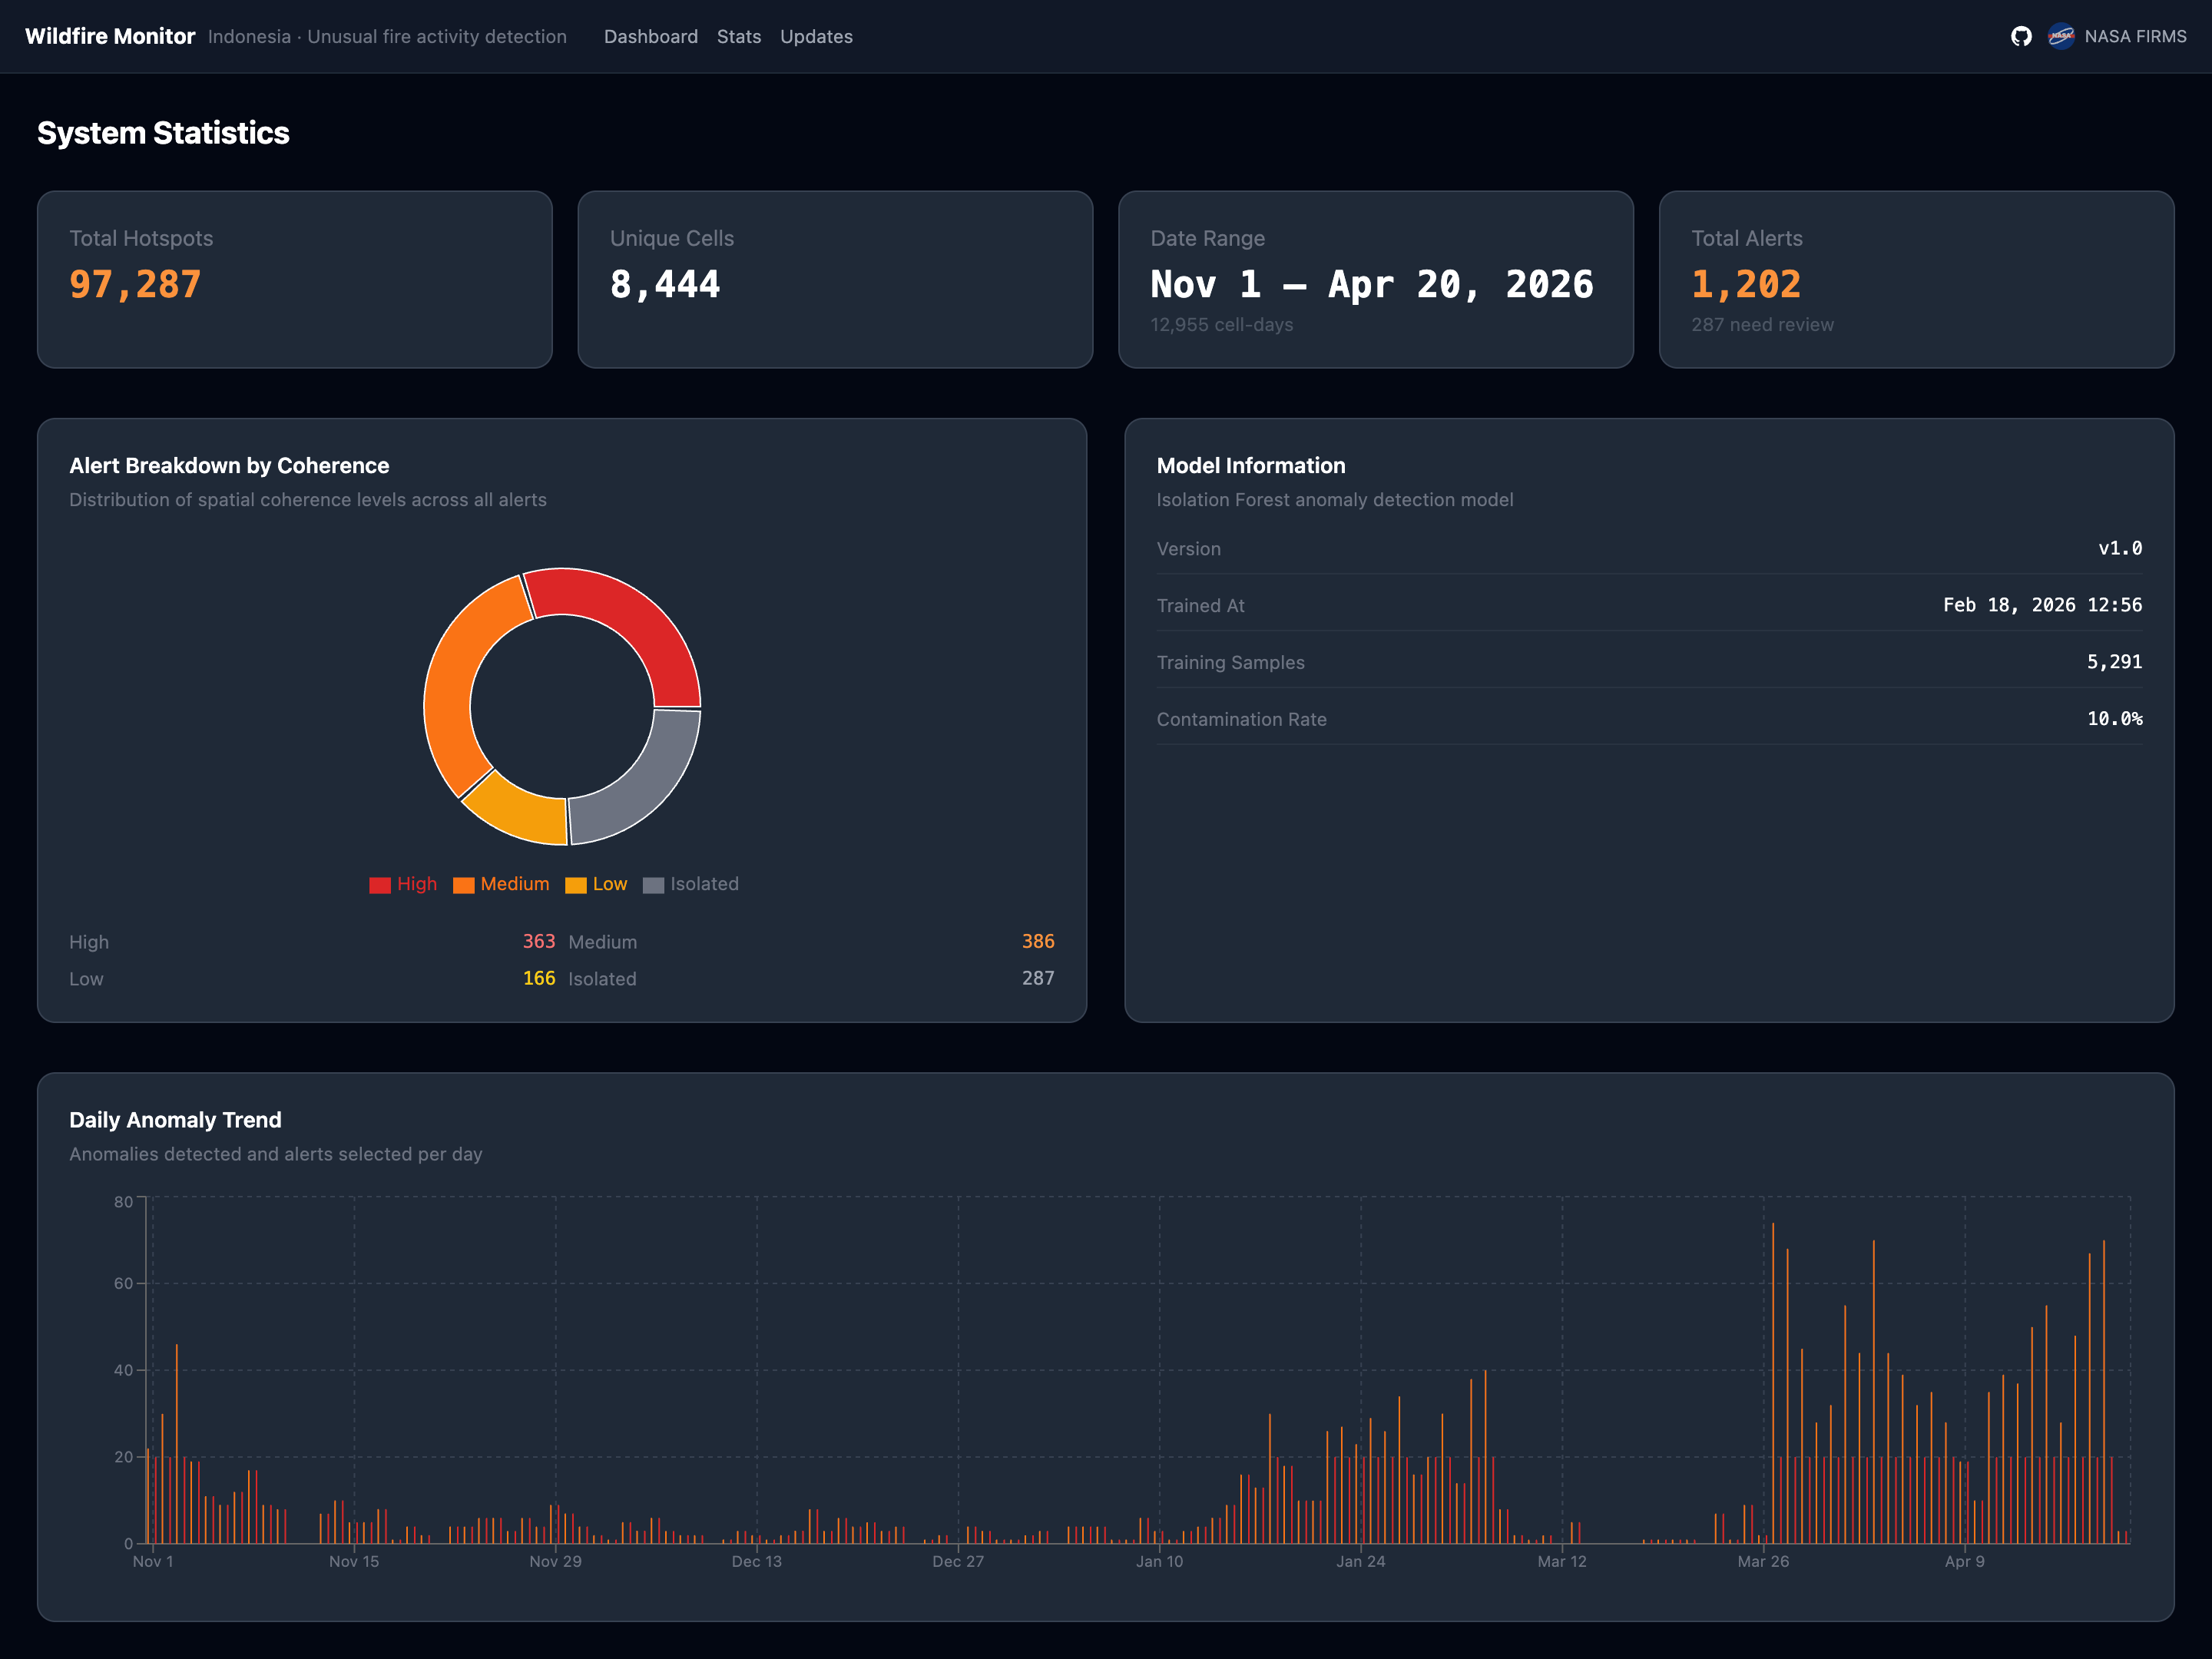
Isolation Forest is an unsupervised machine learning algorithm designed specifically for anomaly detection. Unlike supervised models, it requires no labelled examples of wildfires. Instead, it learns what normal satellite activity looks like for a given area over time, then flags anything that deviates significantly from that baseline.
Build 100 random decision trees and split data by randomly selected features and values. Anomalies get isolated in very few splits because they are statistically unusual. Normal data points require many more splits. The average path length across all 100 trees produces a confidence-weighted anomaly score.
Hotspot count, total Fire Radiative Power (FRP), maximum FRP, day-over-day delta, ratio versus 7-day rolling average, and neighbour activity. No manual thresholds are set. The model self-calibrates to flag the most anomalous 10% of cell-days based on learned patterns.
Rather than working with raw latitude/longitude coordinates, we map every hotspot into Uber's H3 hexagonal grid at Resolution 7 — approximately 5 km² per cell. Hexagons offer a specific mathematical advantage over square grids: every hexagon has exactly six equidistant neighbours, making spatial spread analysis consistent across the entire map without distortion near the equator.
A pure ML anomaly score can surface statistical outliers that are not wildfires. The hybrid scoring layer cross-validates every ML flag against its geographic context. Each alert receives a final score calculated as 70% ML anomaly weight and 30% spatial coherence — how many of the six adjacent cells also show hotspot or anomalous activity on the same day. Alerts with zero active neighbours are flagged for manual review rather than surfaced as high-priority events.

The same pipeline — anomaly detection on geospatial time-series data, with spatial coherence validation — is applicable well beyond wildfire monitoring. Flood inundation, agricultural stress signals, illegal deforestation: the pattern transfers wherever satellite data meets a need for early anomaly detection at scale.
By open-sourcing the project, Itsavirus contributes a working, deployable reference implementation that development teams and research organisations can adapt to their own geography and data sources. The MIT licence means there are no restrictions on commercial or institutional use.
For organisations considering AI integration in their own operations, this project illustrates what practical AI engineering looks like: well-defined inputs, a defensible model choice, spatial reasoning built into the architecture, and a clear path from raw data to actionable output.