Performance issues in distributed systems often surface through symptoms like slow APIs, stalled queues, or unexpected outages.
When they occur, teams typically turn to logs, dashboards, and metrics, but the underlying cause can remain hidden inside interconnected services, queues, and asynchronous flows.
This is where distributed tracing shifts from a technical tool to a strategic capability.
At Itsavirus, we build and modernise complex systems for clients across sectors. Across those projects, one principle stays consistent:
You can’t optimise what you can’t see. And you can’t scale what you can’t trace.
Distributed tracing gives you the visibility that modern architectures rely on.
This article explains how OpenTelemetry + Jaeger form the foundation of that visibility, and why leaders should treat tracing as an engineering requirement, not an optional add-on.
Digital systems rarely remain static.
Monolith → services → microservices → event-driven → AI-driven → hybrid everything.
With each step forward, understanding what is happening becomes harder.
Traditional monitoring tools each offer part of the picture:
But none of these answer the crucial question:
“Where, exactly, does a distributed request slow down or fail?”
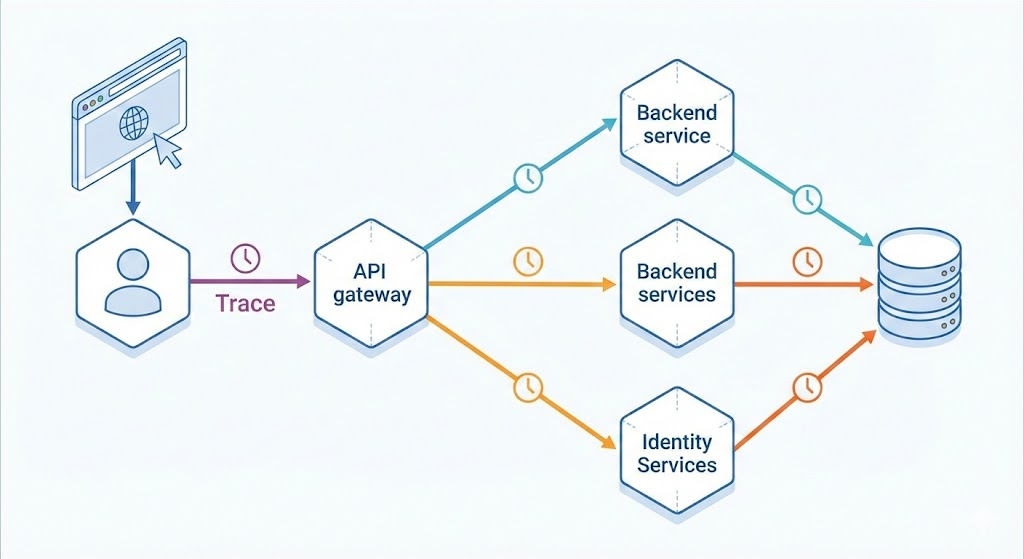
If one user action touches:
— where do you investigate?
This is the gap distributed tracing closes.
OpenTelemetry (OTel) is often mistaken for another monitoring tool.
It isn’t.
It is a standard, a common language that unifies telemetry across your entire system.
OTel provides:
In modern architectures — especially those involving AI agents, orchestrators, and asynchronous workflows — this standardisation eliminates blind spots.
It ensures every component speaks the same telemetry language.
OpenTelemetry gathers the signals.
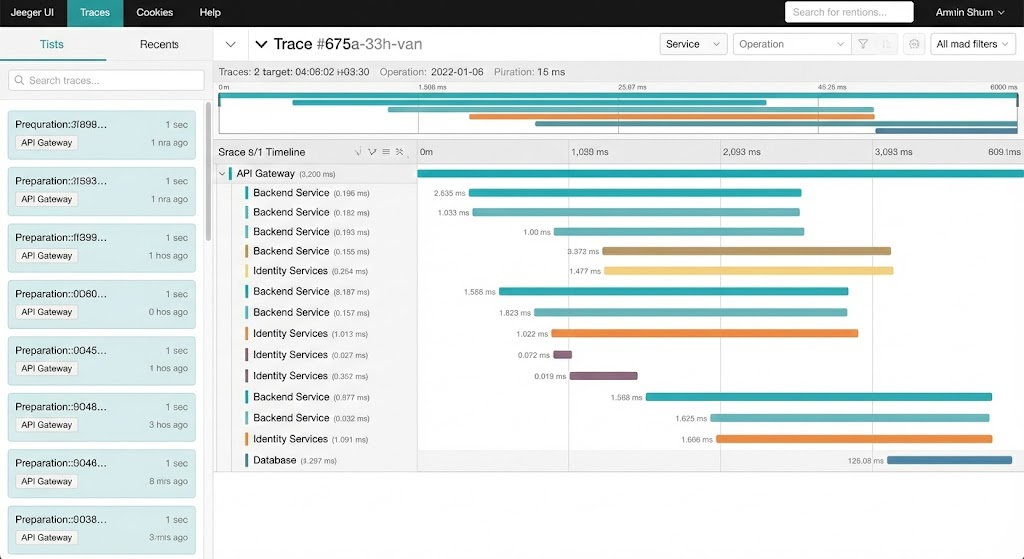
Jaeger turns them into understanding.
Originally developed at Uber, Jaeger provides an end-to-end view of:
This gives engineering, product, and operations teams a shared reality — a complete trace of how a request moves through your system.
For modern, interconnected platforms, this level of visibility is not a luxury.
It’s foundational.
Application Code
│ (Auto + Manual Instrumentation)
▼
OpenTelemetry SDK
▼
OTel Collector (Agent + Processor)
  - Filtering
  - Enrichment
  - Sampling
▼
Exporter
▼
Jaeger Backend
  - Storage
  - Query Engine
  - UI
▼
End-to-end Traces for Analysis
This becomes the backbone of reliability for many of our clients — especially during modernisation or large-scale AI initiatives.
Teams no longer guess where issues originate.
They follow the trace.
Every service call.
Every hop.
Every latency spike.
Engineering effort shifts from intuition to data-led decision-making.
In Strangler Fig modernisation, tracing exposes parity issues early — before they reach production.
Traces become the shared source of truth.
Not opinions. Not assumptions.
If any of the following are true, the right time is before the next incident:
Tracing isn’t something you introduce after things break.
It’s what prevents them from breaking in the first place.
We don’t “add Jaeger” to your system.
We design a complete observability strategy that matches your:
Our approach is built on:
Simplicity, strategic execution, and long-term reliability.
Modern systems fail in the gaps, between services, queues, and asynchronous processes.
Distributed tracing makes those gaps visible.
When implemented with OpenTelemetry + Jaeger, it becomes one of the most valuable capabilities for organisations aiming for reliability, scalability, and clarity.
If you’re exploring modernisation or building systems where reliability matters, we’re happy to share how tracing can become part of your architecture.
No pressure. No push.
Just clarity.
Let’s talk and contact our representatives here