Indonesia loses more than 21 million hectares of forest and peatland to fire each year. Over 100,000 hotspots are detected annually by NASA satellite instruments. The data has always been there. The problem has never been access, it has been making that data useful under real conditions, in near real-time, without a team of analysts sitting behind it.
This is the problem we set out to solve with WildfireDetect, an open-source project we built and deployed for Indonesia. It pulls NASA satellite data daily, runs anomaly detection, and delivers ranked alerts within under an hour, fully automated. No manual analysis. No expensive proprietary infrastructure. MIT licensed and free to self-host.
What started as a technical challenge became a useful exercise in what practical AI engineering actually looks like and what it does not.
NASA's Fire Information for Resource Management System (FIRMS) makes near real-time hotspot detections freely available for the entire globe. VIIRS instruments at 375m resolution, MODIS at 1km, refreshed twice daily. For Indonesia alone, the system produces hundreds of thousands of individual hotspot records each year.
The bottleneck was always downstream. A raw hotspot detection carries no meaning by itself. A single record could be an agricultural burn, an industrial flare, or the beginning of a large wildfire spreading into protected forest. Without a way to distinguish anomalous behaviour from expected baseline activity, that data overwhelms rather than informs.
The challenge was not detecting fire. Satellites already do that. The challenge was detecting fires that matter, anomalies that deviate meaningfully from what is normal for a given location and time.
Most existing approaches address this with fixed thresholds: flag anything above a certain hotspot count, or above a specific fire radiative power value. Those thresholds work reasonably well in some geographies and fail in others. They cannot adapt to seasonal variation, to the heterogeneity of Indonesia's landmass, or to the difference between a controlled burn and a fire spreading uncontrolled.
We built a four-stage pipeline that moves from raw satellite ingestion to validated, ranked alerts without any manual step in between.
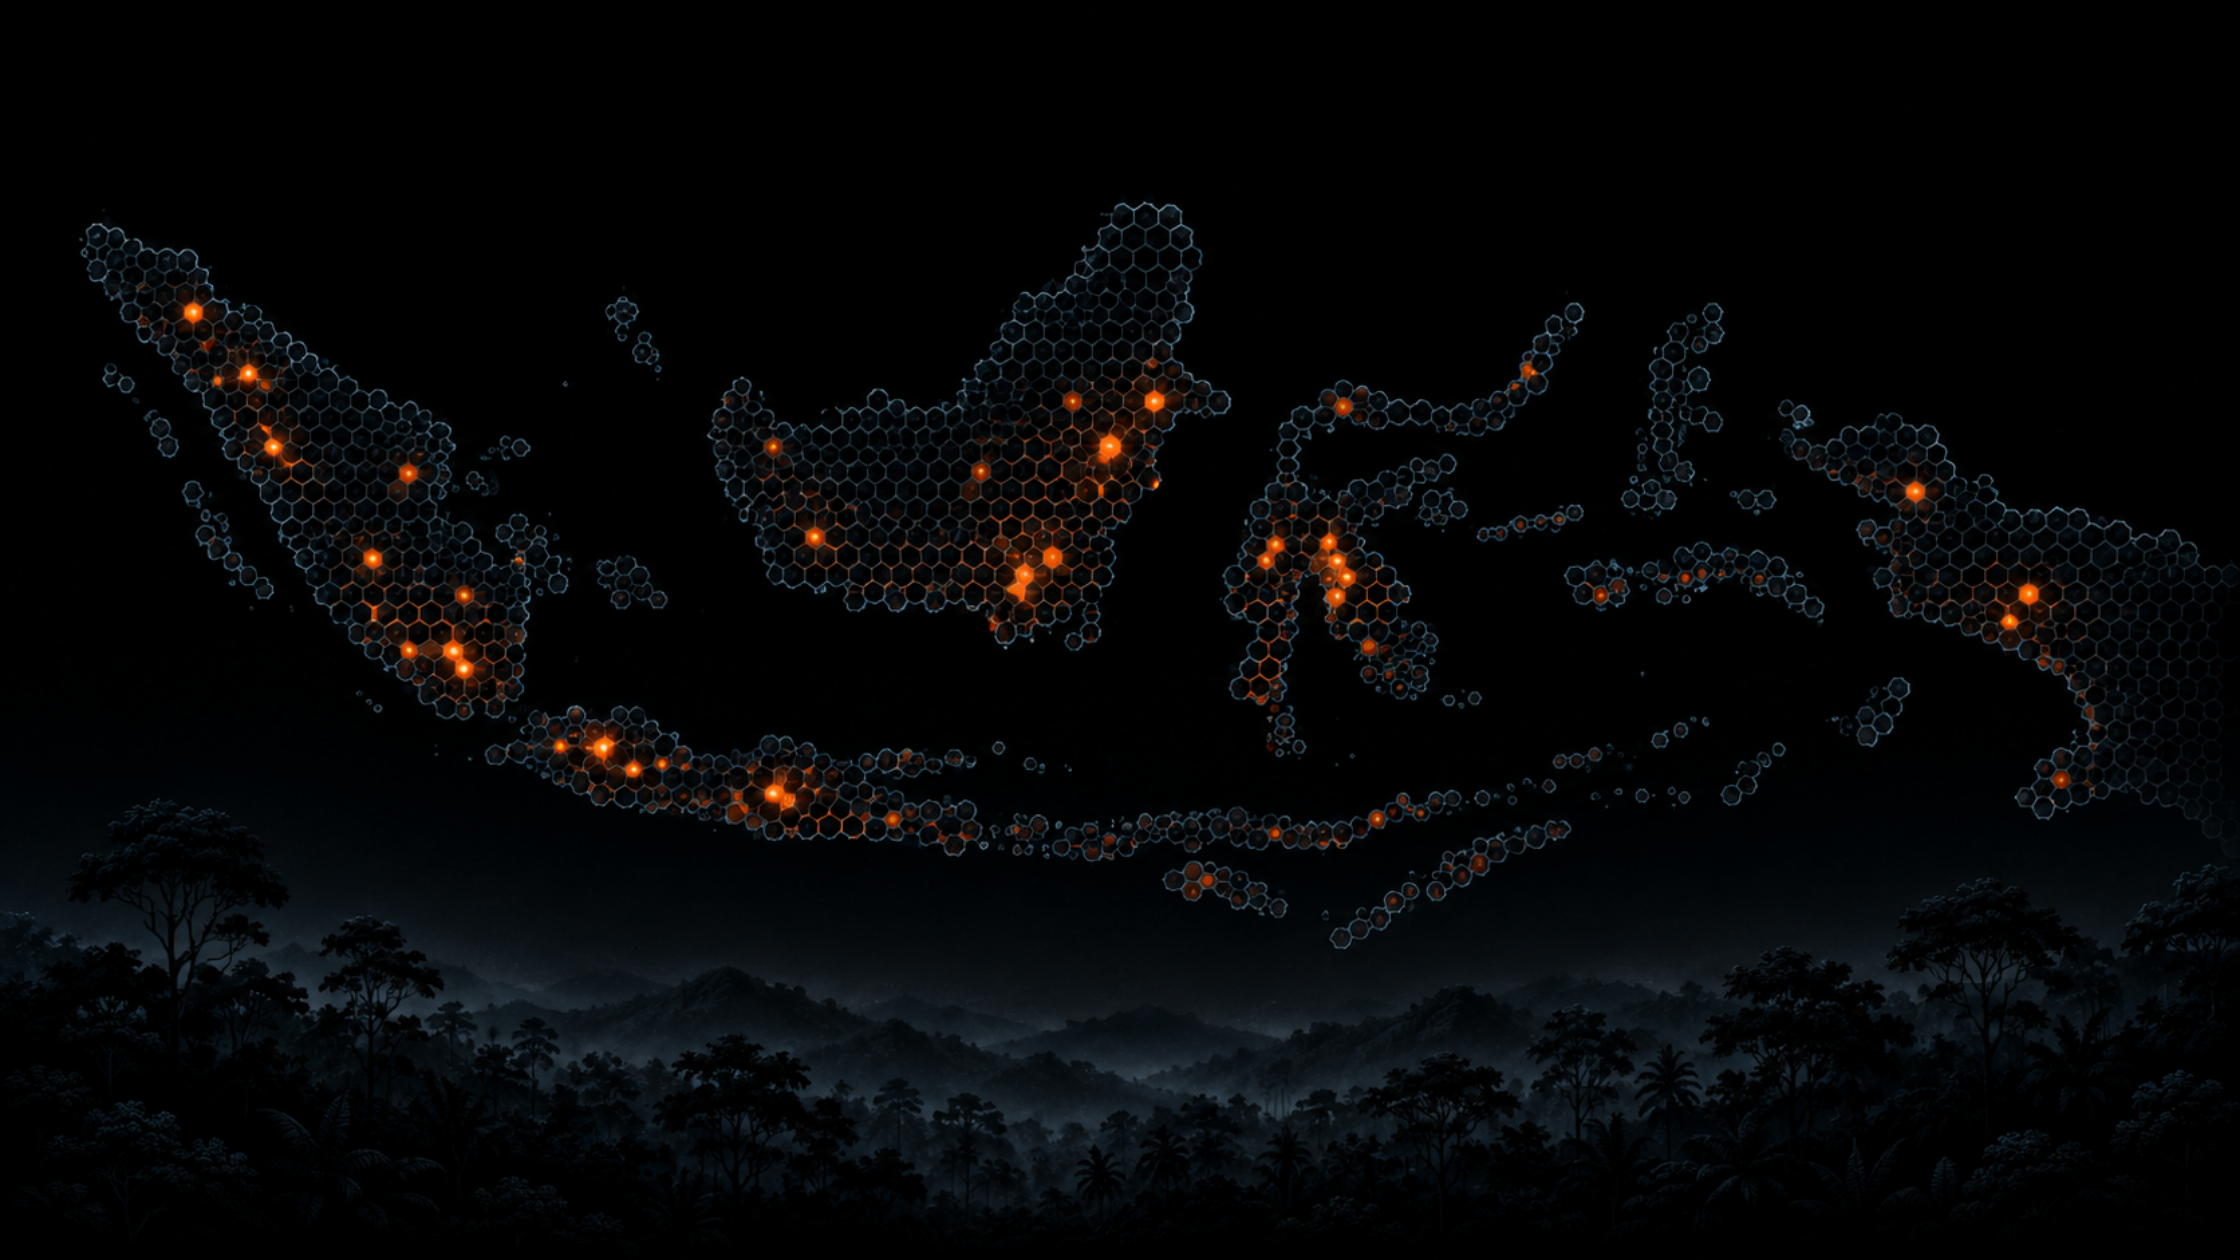
The first stage pulls VIIRS and MODIS hotspot data daily via an automated pipeline and stores it in PostgreSQL. The second stage maps every raw coordinate into Uber's H3 hexagonal grid at Resolution 7 roughly 5km² per cell. Hexagons matter here for a specific reason: every hexagon has exactly six equidistant neighbours, which makes spatial spread analysis consistent across the entire map without distortion near the equator.
The third stage runs the anomaly detection. We use an Isolation Forest model trained on six temporal and spatial features per cell: hotspot count, total fire radiative power, maximum fire radiative power, day-over-day delta, the ratio against a 7-day rolling average, and neighbour activity across adjacent cells. The model self-calibrates to flag the most anomalous 10% of cell-days based on learned patterns. No manual thresholds are set.
The fourth stage applies a hybrid scoring layer. A pure ML anomaly score can surface statistical outliers that are not wildfires. So each alert is cross-validated against its geographic context: the final score is 70% ML anomaly weight and 30% spatial coherence meaning how many of the six adjacent cells also show hotspot or anomalous activity on the same day. Alerts with zero active neighbours are flagged for manual review rather than pushed as high-priority events.
Alerts are classified into four severity tiers and delivered to the public dashboard. Detection latency from satellite pass to ranked alert is under one hour.
The choice of algorithm was deliberate. Isolation Forest is an unsupervised method, which means it requires no labelled examples of actual wildfires to train on. In a domain where labelled ground-truth data is sparse and unevenly distributed geographically, that matters.
The core mechanic is elegant: build 100 random decision trees, splitting data on randomly selected features and values. Anomalies get isolated in very few splits because they are statistically unusual. Normal observations require many more splits to isolate. The average path length across all 100 trees produces a confidence-weighted anomaly score.
Applied to satellite fire data, the model learns what normal looks like for each part of the grid over time, then flags what deviates from that baseline. It adapts to seasonal patterns and regional differences without any explicit rules. That is the core advantage over threshold-based systems.
We open-sourced the project under the MIT licence, with a live public dashboard at app.wildfiredetect.com and a deployable codebase on GitHub. The intention was to contribute a working reference implementation that development teams and research organisations could adapt to their own geography and data sources.
But the wider point is about engineering approach. This project is a reasonable example of what practical AI integration looks like when it is done carefully: well-defined inputs, a defensible model choice, spatial reasoning built directly into the architecture, and a clear path from raw data to actionable output.
The same pipeline, anomaly detection on geospatial time-series data with spatial coherence validation, transfers to other domains. Flood inundation. Agricultural stress signals. Illegal deforestation. Wherever satellite data meets a need for early anomaly detection at scale, the pattern is applicable.
The lesson is not that AI is powerful. The lesson is that a well-scoped AI system with the right inputs and a clear output objective can replace significant manual effort and do it reliably.
The live dashboard for Indonesia is available at app.wildfiredetect.com. The codebase is MIT licensed and available on GitHub under Itsavirus-com/anomalous-wildfire-hotspots-detection.
If you are thinking about how AI integration might work in your own operations, this project is a concrete reference point for what the engineering process looks like in practice. We are happy to talk through how similar approaches might apply to your context.
Reach out at itsavirus.com to explore what this could look like for your organisation.
.jpeg)