How a simple idea from machine learning became the backbone of our wildfire detection system
When we built the wildfire detection system for Indonesia, one of the first questions we had to answer was: what actually counts as an anomalous fire? Indonesia has over 100,000 satellite-detected hotspots every year. Agricultural burns, industrial activity, small controlled fires — they all show up in the data. The satellite cannot tell the difference between a farmer clearing land and the start of a peatland fire that will burn for weeks.
The typical engineering response to this problem is to set thresholds. Flag anything above X hotspots in a grid cell, or above Y fire radiative power. It is a reasonable starting point, but it breaks quickly. Thresholds that work in Kalimantan do not work in Sumatra. Thresholds calibrated for the dry season are too sensitive in the wet season. You end up in an endless cycle of manual tuning, and you still miss outliers that fall just below the line.
We used a different approach: Isolation Forest. It is worth understanding how it actually works, because the mechanics are more elegant than most anomaly detection methods, and the reasoning behind choosing it matters for any team thinking about where ML fits in their own systems.
Isolation Forest is an unsupervised machine learning algorithm, published in 2008 by Fei Tony Liu, Kai Ming Ting, and Zhi-Hua Zhou. The core insight is deceptively simple: anomalies are easier to isolate than normal data points.
Here is the mechanic. You take your dataset and you build a decision tree by randomly selecting a feature and a random split value. You keep splitting until every data point sits in its own leaf. Then you ask: how many splits did it take to isolate this particular point?
Anomalies, by their nature, are unusual. They sit far from the dense clusters of normal data. That means they get separated from everything else in very few splits. Normal points, packed together in typical ranges, take many more splits to isolate. The algorithm builds 100 of these trees and averages the path length for each point across all of them. Short average path length means the point was easy to isolate, and easy to isolate means anomalous.
What you get out is a continuous anomaly score between 0 and 1. Points close to 1 are strong anomalies. Points close to 0 are deeply normal. There is no fixed threshold baked in; you decide how sensitive to make the detector by choosing what score you want to act on.
There were a few reasons Isolation Forest made sense for wildfire detection specifically. The most important one: it is unsupervised. We had no labelled dataset of "confirmed wildfires" to train on. Even if we had, labels would reflect past fires, not future ones. An unsupervised model learns what normal looks like from the data itself, then flags deviations. It does not need someone to have defined the problem in advance.
The second reason is computational efficiency. Isolation Forest runs in roughly O(n log n) time. For a system ingesting daily satellite observations across the entire Indonesian archipelago, millions of rows, every day, fully automated, that matters. More complex density-based methods like DBSCAN or LOF become impractically slow at this scale without significant infrastructure investment.
Third, it handles high-dimensional data without manual feature engineering. We fed the model six features per cell-day: hotspot count, total fire radiative power, maximum fire radiative power, day-over-day delta, the ratio against a 7-day rolling average, and neighbour activity across adjacent hexagonal cells. The model figures out which combinations of those features suggest genuine anomalies. We did not have to specify the relationships ourselves.
It is worth being honest about the limits. Isolation Forest tells you that something is statistically unusual relative to the data it was trained on. It does not tell you why. A single cell registering an anomalous score could be an agricultural fire that got bigger than expected, an industrial flare on an unusual day, or the genuine start of a spreading wildfire. The model cannot distinguish between them.
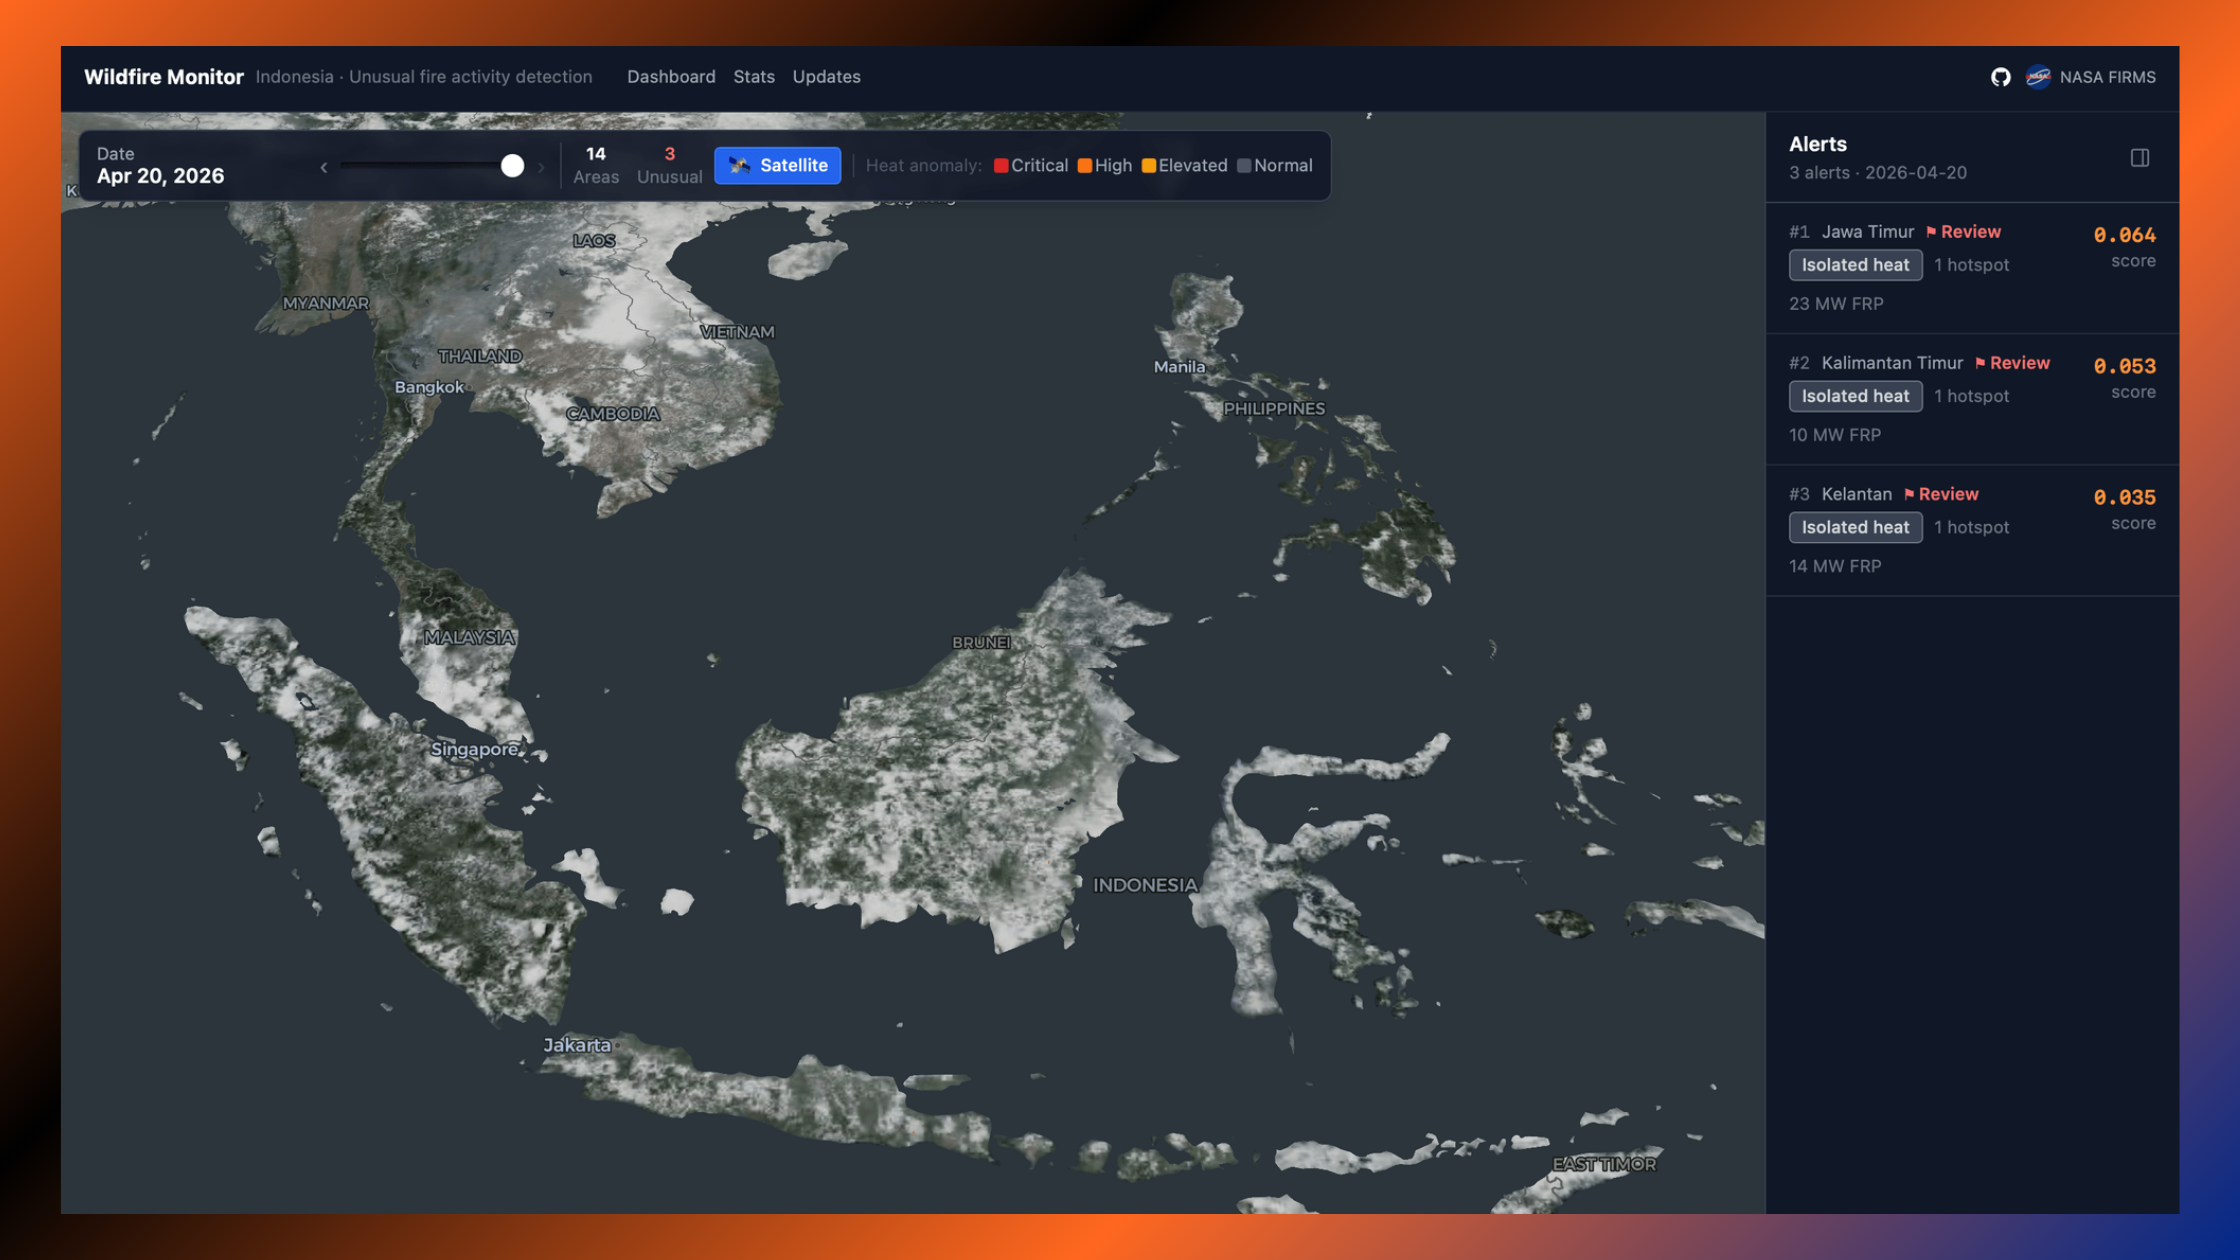
That is why we added a spatial coherence layer on top of the ML score. Every alert gets cross-validated against its geographic context: how many of the six adjacent hexagonal cells are also showing hotspot or anomalous activity on the same day? A genuine wildfire tends to spread or appear in clusters. An isolated spike in a single cell with no active neighbours gets flagged for manual review rather than surfaced as a high-priority event.
The final alert score is a weighted blend: 70% ML anomaly score, 30% spatial coherence. It is not a perfect system. No automated detection system is. But it is a significant improvement over static thresholds, and it produces ranked daily alerts in under an hour without any manual analysis in the loop.
What we found with the wildfire project generalises. Isolation Forest is useful wherever you have time-series or sensor data and you want to find the signal in the noise without requiring labelled training examples. Fraud detection in financial transactions. Equipment failure prediction in industrial operations. Unusual patterns in server logs or application performance data.
The algorithm itself is not the hard part. The hard part is everything around it: deciding which features to feed the model, structuring the data pipeline so it can run reliably at scale, validating that the outputs are actually useful and not just statistically interesting. That is where most AI integration projects run into trouble, not because the algorithm is wrong, but because the surrounding engineering is underestimated.
In our case, the spatial coherence layer was more important than the ML model in isolation. The hexagonal grid structure using H3 made the neighbour calculations consistent and distortion-free across a geographically complex archipelago. None of those choices are obvious upfront. They come from thinking carefully about what the model needs to be right, not just technically functional.
If you are evaluating where anomaly detection or ML-based monitoring could add value in your own operations, the wildfire detection codebase is open-source under MIT licence at wildfiredetect.com. It is a working reference implementation, not a demo.
Now, if you are working through a similar problem, finding signal in messy operational data, or thinking about where ML fits in your infrastructure, we are happy to think it through with you. Reach out at itsavirus.com.